Climate CO2 Forecasting ML
Atmospheric CO2 forecasting needs leakage-safe time-series evaluation rather than a visually impressive model trained on future information.
- Project type
- Data and ML
- Core stack
- Python, pandas, statsmodels
- Delivery
- Case study
Case Study
The problem, implementation decisions, measured evidence, and next improvements.
Overview
An end-to-end forecasting and anomaly-analysis system with reproducible data preparation, model comparison, API serving, and dashboard evidence.
Problem
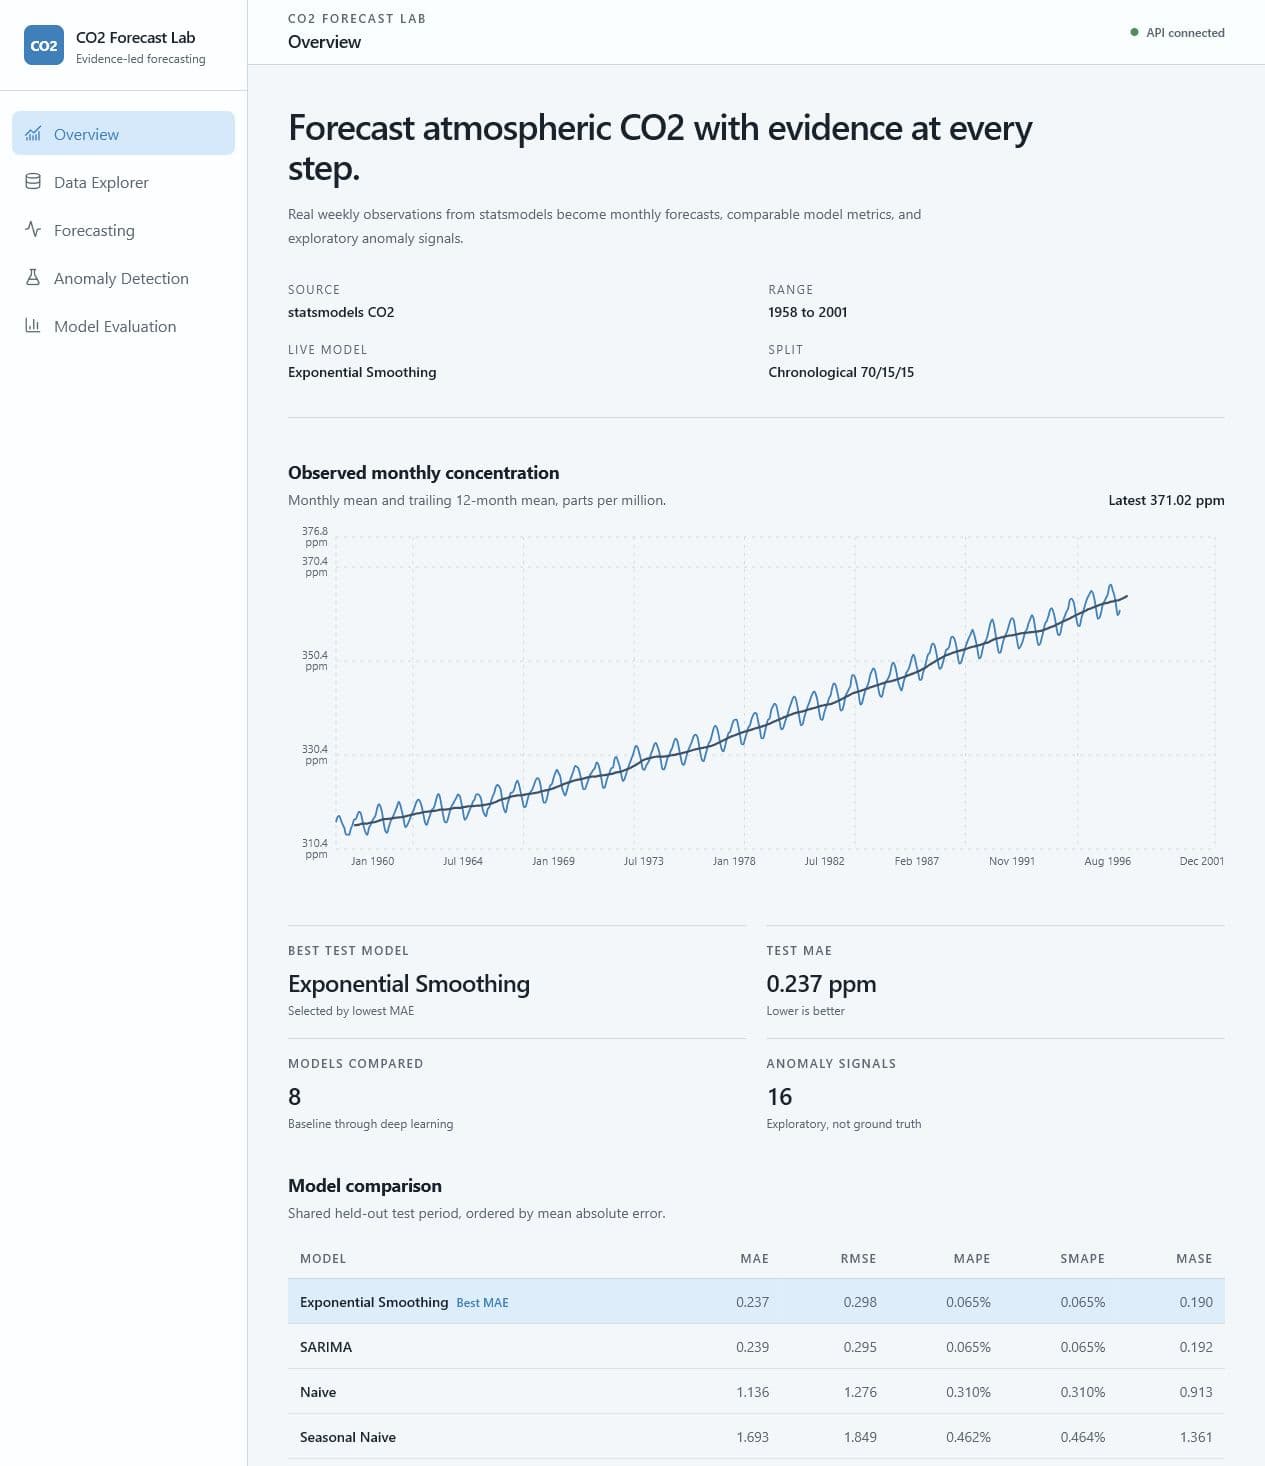
The weekly Mauna Loa CO2 series contains missing values, long-term trend, and strong annual seasonality. A credible project must compare simple and complex models on the same chronological holdout.
Solution
Built a reproducible pipeline for validation, monthly resampling, chronological splits, feature engineering, baseline/statistical/scikit-learn/PyTorch training, shared metrics, residual analysis, anomaly signals, FastAPI inference, and a React dashboard.
Outcome
Exponential Smoothing and SARIMA clearly outperformed the more complex machine-learning models. The project reports that result directly and keeps anomaly detection framed as exploratory rather than verified climate-event detection.
What It Proves
Time-series methodology, leakage prevention, honest model evaluation, statistical forecasting, PyTorch experimentation, FastAPI, React, and reproducibility.
Key Features
- Chronological train, validation, and test splits prevent future leakage.
- All models share the same rolling one-step evaluation and residual analysis.
- Generated artifacts feed both the FastAPI service and React dashboard.
Architecture
- 01
statsmodels CO2 dataset
- 02
Validation and resampling
- 03
Chronological split
- 04
Forecasting models
- 05
Shared evaluation
- 06
Anomaly analysis
- 07
API and dashboard
Tech Stack
- Python
- pandas
- statsmodels
- scikit-learn
- PyTorch
- FastAPI
- React
- Recharts
- Docker
Challenges & Trade-offs
- 2,284 weekly rows become 526 monthly observations after resampling and interpolation.
- Exponential Smoothing achieved MAE 0.237 and RMSE 0.298 on rolling one-step evaluation.
- The two-epoch LSTM debug run underperformed, demonstrating that complexity is not automatically better.
Future Improvements
- Run a fully tuned LSTM experiment separately from the fast debug pipeline.
- Add probabilistic forecast intervals and backtesting windows.
- Deploy the API and dashboard together for a public interactive demo.
Repository README, generated metrics, and public GitHub presentation reviewed June 13, 2026.